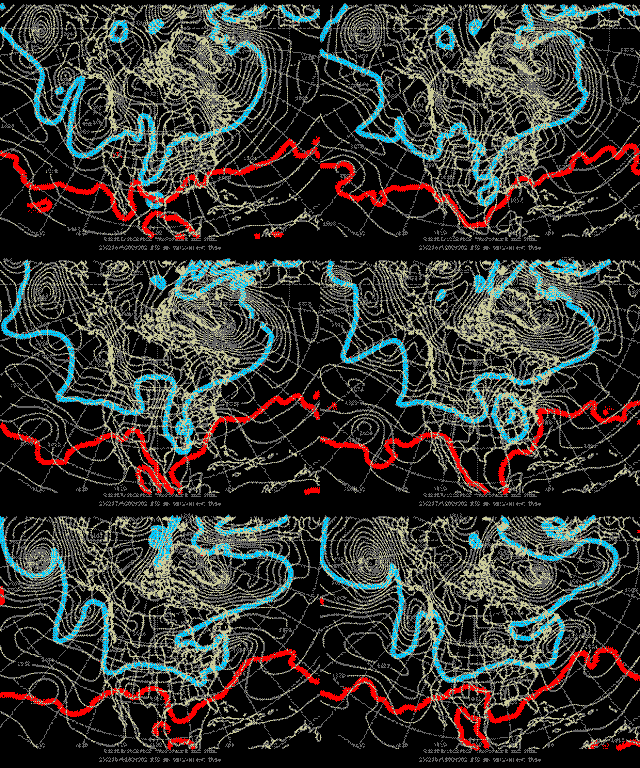
Animated tropopause maps at 12 hour intervals during the Blizzard of 2003, a typical "northeaster" with record breaking snowfall for Boston. Tropopause maps such as these are an analysis of potential temperature (color contours) on a surface of constant potential vorticity, Q (Q = 2.0 PVU). This analysis contains the essential information needed to understand the dynamics of weather systems within the troposphere. "Cold" tropopause (i.e. low potential temperature) regions are associated with cyclonic circulations, while "warm" tropopause regions are associated with anti-cyclonic circulations. (Image by Dr. Lodovica Illari.)
Instructor(s)
Prof. Glenn Flierl
Dr. Lodovica Illari
MIT Course Number
12.804
As Taught In
Fall 2009
Level
Graduate
Course Description
Course Description
This course is a laboratory accompaniment to 12.803, Quasi-balanced Circulations in Oceans and Atmospheres. The subject includes analysis of observations of oceanic and atmospheric quasi-balanced flows, computational models, and rotating tank experiments. Student projects illustrate the basic principles of potential vorticity conservation and inversion, Rossby wave propagation, baroclinic instability, and the behavior of isolated vortices.


